Predicting Character Deaths in Game of Thrones#
Authors: Thomas Jian, Ian MacCarthy, Arturo Rey, Sifan Zhang
Summary#
We build a prediction tool that predicts whether a given character from the Game of Thrones books will survive to the end of the series. To do this, we implement a logistic regression model on a data set containing character information. The model is not able to achieve prediction accuracy any better than 65%. This is likely due to an absence of strong patterns in the plot and cast of characters that would allow us to easily answer such a question.
Introduction#
The popular novel series Game of Thrones by George R. R. Martin takes place in a fictional world inspired by medeival Europe. Warfare and violence are central to the plot, leading to frequent casualties among the expansive cast of characters. Exactly which characters are fated to die before the end of the series has become a topic of heated speculation.
In this analysis we try to predict whether a character will come to grief before the end of the series based on that character’s attributes. We consider a data set created by Data Society available through data.world [Data Society, 2016], which comprises a comprehensive list of characters appearing in the series. For each character there is a number of attributes, such as whether the character is noble, whether they appeared in a given book in the series, whether a relation of theirs is already dead, and finally whether or not the character is still alive at the end.
Methods and Results#
A concern of ours having seen the data is that there are a number of columns which are filled almost completely with missing values. These represent information that is only known for a very small minority of characters, like whether their parents are alive and who their heir is. We decided to drop columns that were almost entirely missing values, like isAliveFather. In other cases like House, where the missing values represent characters who are not noble and thus do not belong to a house, we filled the missing values with a new category like ‘No house’. Also these columns contained a great number of unique categories; for simplicity’s sake we decided to keep only the most common categories and filled all the other values with ‘other’. Finally for age, which is unknown for about half of the characters, we filled missing values with the median age.
| Feature | Percent NaN | |
|---|---|---|
| 0 | S.No | 0.000000 |
| 1 | plod | 0.000000 |
| 2 | name | 0.000000 |
| 3 | title | 0.517986 |
| 4 | male | 0.000000 |
| 5 | culture | 0.652107 |
| 6 | dateOfBirth | 0.777492 |
| 7 | DateoFdeath | 0.771840 |
| 8 | mother | 0.989209 |
| 9 | father | 0.986639 |
| 10 | heir | 0.988181 |
| 11 | house | 0.219424 |
| 12 | spouse | 0.858171 |
| 13 | book1 | 0.000000 |
| 14 | book2 | 0.000000 |
| 15 | book3 | 0.000000 |
| 16 | book4 | 0.000000 |
| 17 | book5 | 0.000000 |
| 18 | isAliveMother | 0.989209 |
| 19 | isAliveFather | 0.986639 |
| 20 | isAliveHeir | 0.988181 |
| 21 | isAliveSpouse | 0.858171 |
| 22 | isMarried | 0.000000 |
| 23 | isNoble | 0.000000 |
| 24 | age | 0.777492 |
| 25 | numDeadRelations | 0.000000 |
| 26 | boolDeadRelations | 0.000000 |
| 27 | isPopular | 0.000000 |
| 28 | popularity | 0.000000 |
| 29 | isAlive | 0.000000 |
As a rule of thumb, we usually drop features whose percentage of missing values are over 15/20/25%. This is done because imputing these values, or replacing them with the mean/median/mode, would create bias in our data. Another way to deal with this case, would be to drop all the columns where we have null values in. This is a viable approach when the number of null values are not a big part of the dataset. Considering that a couple of features have a great percentage of missing values (> 25%), we have dropped these features from our training and test set in order to not influence our model by adding bias by imputing values.
Among those features we picked for further analysis, some are easily understood by the feature names while some others might be hard to read and understand, so descriptions of these features are provided below.
Culture: Social group to which a character belongs
House: House to which a character belongs
book1,book2,book3,book4,book5: Whether or not the character is mentioned in the book
numDeadRelations: Number of dead characters to whom a character is related
Popularity: popularity score calculated from the number of internal incoming and outgoing
links to the characters page in the http://awoiaf.westeros.org wiki
Target:whether or not the character is alive
Based on the selected features, we created a heatmap [Östblom, 2023] to illustrate the correlation of each feature with isAlive. None of the correlations, in Figure 1, are particularly strong, but they seem to make sense. There is a notable positive correlation with whether the character is alive in book 4, which makes sense given that a character has no chance of being alive at the end of the series if they aren’t still alive at book 4. There are also notable negative correlations with the character’s popularity and the number of dead realtions the character has, suggesting that popular characters whose families are already depleted tend to survive in the story.
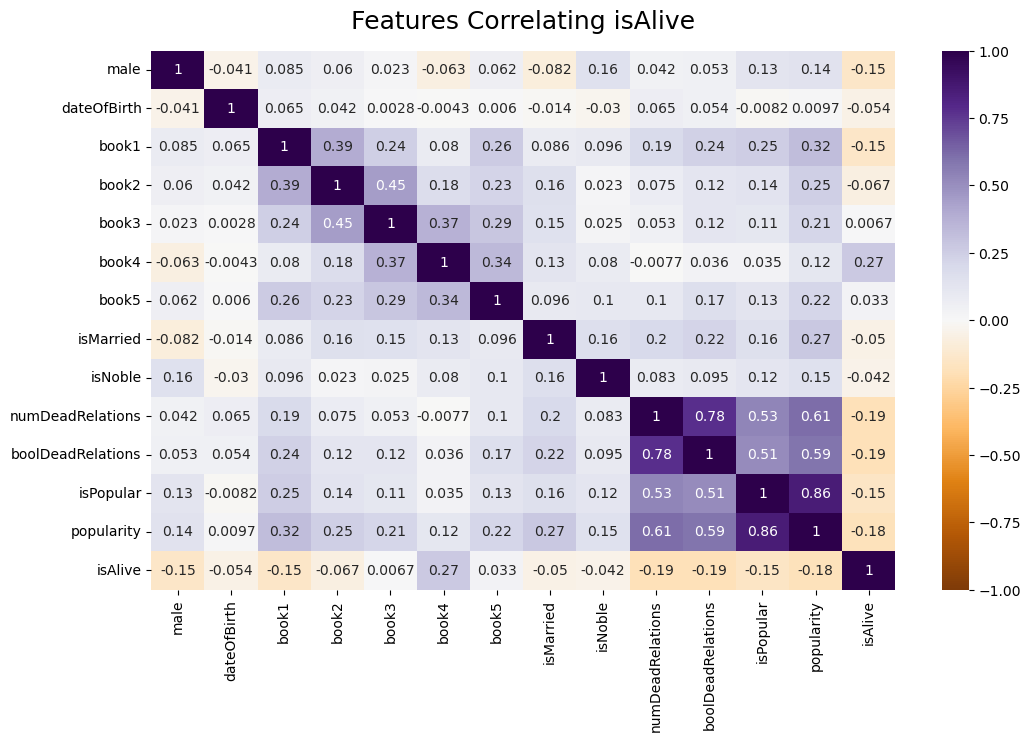
Fig. 1 Correlation heatmap for all features in processed data#
Using this cleaned data set, we then constructed a column transformer to prepare the data for machine learning purposes. We tried a selection of different machine learning models: dummy, k-NN, SVM, and logistic regression [Kolhatkar, 2023]. We found that the logistic regression model performed the best based on f1 score, with test_f1 of 0.427, and so undertook randomized hyper-parameter optimization [Östblom, 2023] to fine-tune that model.
The results of a randomized grid search with cross validation is shown below.
| param_logisticregression__C | param_logisticregression__max_iter | param_logisticregression__class_weight | mean_test_score | mean_fit_time | mean_train_score | |
|---|---|---|---|---|---|---|
| 0 | 0.000 | 500 | balanced | 0.516 | 0.020 | 0.518 |
| 1 | 0.000 | 2000 | balanced | 0.516 | 0.020 | 0.518 |
| 2 | 0.048 | 100 | balanced | 0.502 | 0.038 | 0.516 |
| 3 | 0.886 | 2000 | balanced | 0.501 | 0.041 | 0.519 |
| 4 | 69.519 | 2000 | balanced | 0.498 | 0.042 | 0.525 |
Having found this best performing model, we tried it out by deploying it on the test set. The classification report is shown below, along with a precision recall curve and a reciever operating characteristic curve
| precision | recall | f1-score | support | |
|---|---|---|---|---|
| 0 | 0.876984 | 0.609235 | 0.718991 | 1451.000000 |
| 1 | 0.395522 | 0.749495 | 0.517795 | 495.000000 |
| 2 | 0.644913 | 0.644913 | 0.644913 | 0.644913 |
| 3 | 0.636253 | 0.679365 | 0.618393 | 1946.000000 |
| 4 | 0.754516 | 0.644913 | 0.667813 | 1946.000000 |
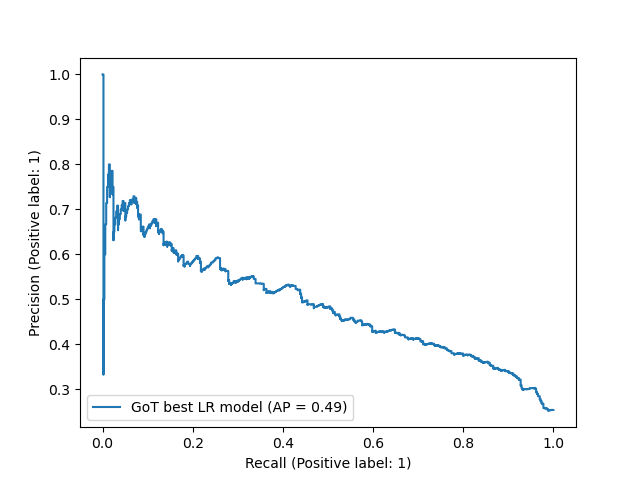
Fig. 2 Precision Recall Curve for the best model#
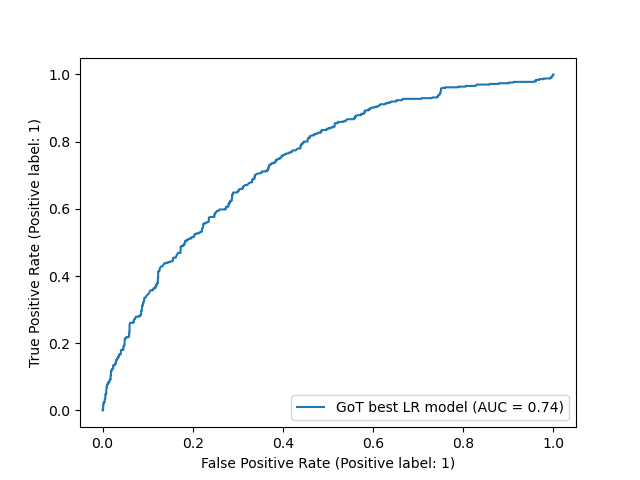
Fig. 3 RoC Curve for the best model#
For both classes (0 = character survives, 1 = character dies), the model’s recall is comparable, show in Figure 2 and Figure 3. However for class 1 the model’s precision is much lower, indicating that it is a bit too quick to predict the demise of a character. This could perhaps be improved in future by altering the class weights.
Discussion#
Overall the model’s accuracy is fairly unimpressive, correctly predicting the fate of a character in only about half of all cases. While this might seem a bit disappointing, it did not particularly surprise or discourage us: George R. R. Martin is a celebrated author and master story teller, and the fact that we can’t easily predict a whether a character will survive based on their attributes is a testament to the quality of his writing rather than the inadequacy of our model. Of course, this prediction tool is largely humerous and unlikely to make much of an impact beyond this project, it is nevertheless interesting to have a quanititative assessment of a plotline’s predictability!
References#
- Kol23
Varada Kolhatkar. Dsci571 course notes. https://pages.github.ubc.ca/MDS-2023-24/DSCI_571_sup-learn-1_students/lectures/00_motivation-course-information.html, 2023.
- DataSociety16
Data Society. Requests: game of thrones. https://data.world/data-society/game-of-thrones, 2016.
- Ost23a
Joel Östblom. Dsci531 course notes. https://pages.github.ubc.ca/MDS-2023-24/DSCI_531_viz-1_students/lectures/4-eda.html, 2023.
- Ost23b
Joel Östblom. Dsci573 course notes. https://pages.github.ubc.ca/MDS-2023-24/DSCI_573_feat-model-select_students/README.html, 2023.